
The following chart will accompany my short analysis that will appear in the Railway Market magazine. Two ideas make this chart very interesting for investors. Firstly, the transport sector swallows up a great part of equity and debt available in Hungary, so the performance of the sector is also interesting. Secondly, as Hungary as an important manufacturing country, the transport figures are also important in the evaluation of the business cycle. The upper charts who the weight lifted (tonnage put on vechicles) in Hungary (domestic and international relations). The lower charts (not so reliable because of the shortcomings of statistical data gathering) show the transport performance in Hungarian territory, also in domestic and international ordering.
The decline in transport lifted in Hungary shows decrease of Hungarian manufacturing, and also the decrease in fuel use accompanied it. Domestic recovery has not started yet in 2009Q4. However, most of the international transport performance is only transit, mainly from East (raw materials and fuels) and to West (finished goods from Balkans and beyond). The recovery in international trade and manufacturing is visible in that chart.
5/09/2010
Freight Transport Market in Hungary - Consequences and Indicators of Recession


2/05/2010
Czech Republic: Cautious Optimism with Gloomy Consumers
The economic sentiment indicator recorded by the Czech Statistical Office is on the rise. Comparing to the same period in last year the economic sentiment indicator is 11.4 points up. Unlike Slovak consumers, the Czech households fear unemployment and worse personal financial situation. Companies in the industry, construction, trade and service are all cautiously optimistic.This is good news for the investor as the Czech economy is very much export-driven and low domestic spending does not effect many companies.
Slovakia: Upbeat Services and Consumers, Pessimistic Construction Industry
The Statistical Office of the Slovak Republic published its recent results of the business tendency surveys. Its main indicator its the economic sentiment indicator (ESI).The ESI is composed of the industrial confidence indicator, the construction confidence indicator, the retail trade confidence indicator, the service confidence indicator and the consumer confidence indicator. Confidence levels reached the bottom in May 2009. In January 2010 compared with December 2009 its value has grown by 2.4 to 84.8 percentage points. The increase was mainly caused by the consumer and service sector. The consumers are more optimistic than a year ago, the construction industry is 26 points under its long-term average and still decreasing.
1/25/2010
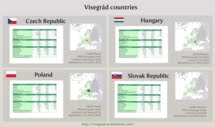
Homogeneity of the Visegrad Group
I find it a very interesting and also important question to see how similar are the Visegrad countries, i.e. the Czech Republic, Hungary, Poland and Slovakia compared to other EU or Eastern-European countries. The more similarities we find in economic performance or structure, or in economic decision, the more likely that the group will share common interests, and it makes more economic and political sense to act as a group against other countries. However, if one or two EU member states are more similar to their other neighbors, they will have a motivation to undermine the V4 group.
With my colleagues we are working in such a comprehensive study. We have found some instances, where the Visegrad countries are the most alike in the whole Europe, including non-EU members, but there are very important differences.
One of our methods is to compare the variances of economic indicators in the EU, the V4, and 102 hypothetical regroupings (each derived with substituting the data of one V4 country for another EU-27 country that is not in the group).
Regarding GDP per capita adjusted for the price level, the most important indicator in the EU to assess the development of a country shows that the V4 countries have been in a rather similar economic situation in the 1990s and 2000s. However, Central-European countries could have formed a more similar group. In 1999 the Czech Republic was a positive outlier from the group with a higher income level. Substituting the Czech Republic with Lithuania, we could have got a more homogeneous economic group which would have been continuous in a geographical sense. Further changing Lithuania to Estonia we would have got an even more homogeneous group.
By 2004, when the V4 countries have joined the EU together with Lithuania and Estonia among others, we had a slightly altered image. The Czech Republic remained slightly richer and Poland became slightly poorer, allowing for such a regrouping that could have resulted in a more homogenous group of the Czech Republic, Hungary, Slovakia and Portugal or Malta. This also shows that the V4 has reached the income level of Portugal that has started her economic transition more than a decade earlier than the V4.
Currently (using the latest 2008 data) the V4 still remains a relatively homogeneous group, but almost any regrouping with the three Baltic states, Malta or Portugal would lead to a similarly developed economic bloc. From this perspective it looks that the V4 share comparatively less with each other than with other, relatively new or peripheral EU states in the East or in the South.
We will carry on these analysis with a number of structural and dynamic variables to understand what economic force bound the V4 together and what pulls them apart. The first impression is that the V4 is still a very homogeneous group with a shared economic situation and economic institutions, which makes the case for further co-operation and also them a significantly unique regional submarket of the single European market from a business or investment point of view.
Our working paper will be published on the subject on 12 February 2010.

 Bejegyzések


